On any given day, social media managers develop meaningful strategy, a robust content calendar, perform community management, and are available when issues arise. Higher ed marketing social managers do all this while balancing strict university brand standards, thin budgets, expectations from leadership, and more – including reporting social media metrics.
There are monthly reports, quarterly reports, annual reports – and of course, ad-hoc requests when leadership needs something. With all these moving pieces, it can be difficult to create reports that are anything more than listing out KPIs in a PowerPoint.
Three Steps for Reporting Social Media Metrics in Higher Ed Marketing
In this post, I’m going to share with you three key ways in which you can upgrade your social media reporting, and I will suggest some processes to make your reporting stronger in the long run.
Step One: Shape Your Report with Stakeholders in Mind
Social media management strategies are centered around your audiences and how they want to interact with your company. When you manage social for a traditional brand, you’re trying to satisfy your customer – your end user. You may have three to five segments that you really want to connect with.
Directing social media for a university is exponentially more nuanced – because your “customers” are not just students – although they’re a huge part of your strategy.
List Out Possible Stakeholders
|
|
Across a university, stakeholders have very different goals and preferences – some in direct contrast with each other. As a social media manager in higher ed marketing, you know how to balance all of these stakeholder goals as you develop your social media strategy. You know which types of content resonate with each audience.
Bring This Balanced Strategy into Your Reporting
It’s key to bring your understanding of each stakeholder into your strategy and when you’re reporting social media metrics. This can improve your overall impact in two ways:
- It demonstrates that you have a deep understanding of who these stakeholders are and what they want, showcasing how your channels are deepening connections between your institution and its constituents.
- It personalizes your report; it is likely that at least one of these stakeholders is going to be receiving the report. Now they’re going to be more invested in what you’re saying – and potentially provide future support.
Utilize Existing Documents Like Strategic Plans and Mission Statements
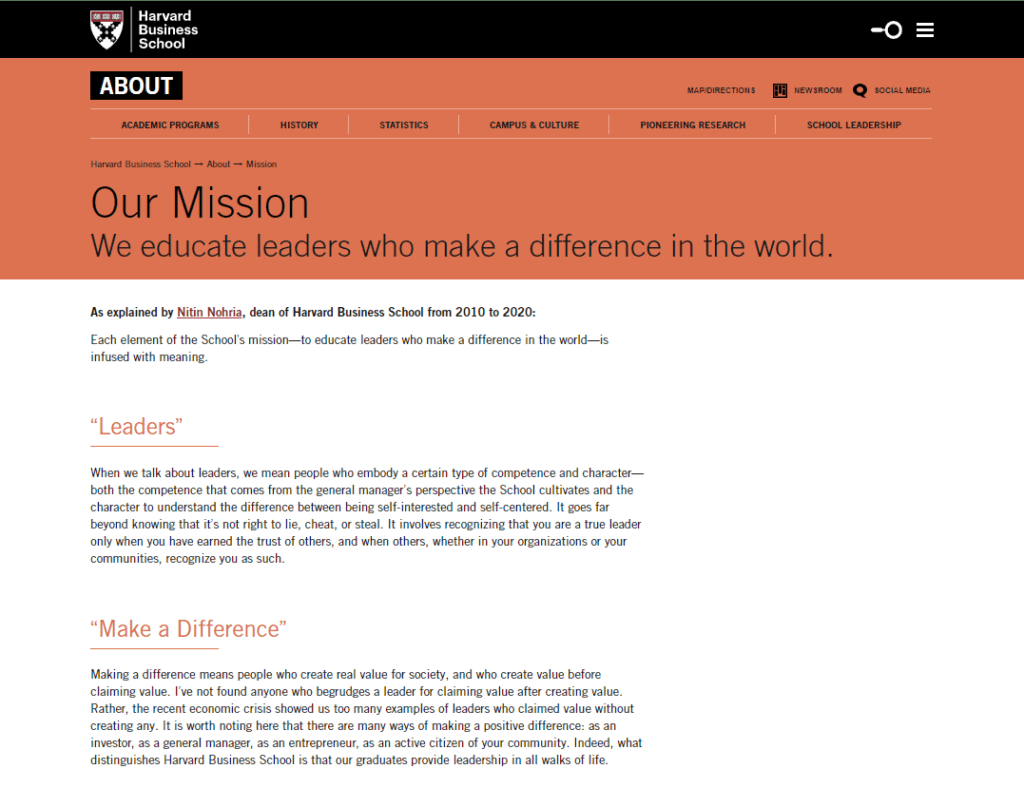
The easiest way to reflect the needs of your various stakeholders is to consider their priorities and goals at the beginning stages of drafting your report. Luckily, in some cases, these goals are documented. Your institution likely has some version of a strategic plan or mission. So does your marketing unit, which may even have more explicit benchmarks or KPIs that you can reference as you build your report.
Explore Goals and Priorities at Every Level
- Institution
- Unit/Department
- Program
- Personal

Keep Key Points For Each Audience in Mind
Ideal Use of Social
|
→ | Opportunities for Reporting
|
Other stakeholders may have goals that are more abstract. Faculty members want to see their programs presented in a positive way. Students want to see their university speaking about timely topics on news-based platforms, and these same students want to see their peers on more aesthetic platforms.
Step Two: Develop a Narrative Around Your Metrics
Quantifying Efforts to Balance Priorities
Social media reports typically show numbers in a vacuum, but the best way to showcase your platform’s performance and your value as a social media marketer is to tell that story of how you’ve managed to balance the wants and needs of priority stakeholders.
Group Content by Campaigns, Audiences, or Institutional Priorities Using Tags
How do you get a quantifiable number that shows you’re satisfying each stakeholder? Tagging. If you use a social media management platform like Hootsuite or Sprout, you can add internal tags to each outgoing post. While this may seem tedious, it provides a really important log that you can use to your advantage when you start reporting.

- Establish a tag, or a category, for each type of content that you’re reporting on. This can be anything from annual giving campaigns to student spotlights to institutional priorities – diversity and inclusion, for example, is an important priority for many institutions, so you could track frequency and types of content you posted about under that tag.
- Pull the data from your social management tool for your report, including the tags that you assigned to each post.
- Filter by these tags and count how many times you talked about a certain topic on your channels, as well as how these posts performed.
Tags make your reporting process simpler and prove that you are featuring a curated set of stories and content from around the university, satisfying each stakeholder’s goals.
Don’t Rely on Metrics Alone – Give Context on the Strategy and Quality of Posts within Each Tag
- Don’t stop at metrics by platform and tag
- Treat each goal/priority as a mini-report
- Tell the story of your campaigns
Traditional social reports are based on metrics like impressions, engagement, follower counts, etc. These metrics can help provide you with insights, but you have to consider if your VP of Marketing, President, Provost, or Admissions Director knows what an engagement rate is or what it means as it relates to their role.
Even if you’ve done a great job of tagging your posts and connecting metrics to goals (e.g., posts where we talked about diversity got 100,000 impressions), you need more to communicate effectively with a board member or a director who’s not as familiar with social media. To make the report more digestible, put your metrics alongside a story.
Metrics you may feature:
|
Context to include:
|
Example: Spotlight on #GivingTuesday
Bring your metrics to life and showcase the amount of work and time it takes to develop a really successful social campaign.

Using tags, you can easily report on impressions and engagement. To elevate this, talk about what you did and how you did it! Remember to tailor the story to the priorities of your audience. Also consider:
- Did you partner with another group (alumni association, student ambassadors, etc.) to create content?
- How did your social media campaign support other marketing efforts around this initiative?
- Did you do something beyond a simple post – go live, take a poll, solicit student stories, etc.?
Use Tracking to Show How Social Drives Traffic to Key Pages
- Utilize UTM codes when linking to your institution’s site from posts
- UTM tracking codes attach to links so you can track the path of users who enter your pages (from Facebook/Meta, for example). This can get as granular as a campaign, like Giving Tuesday. It’s best to connect with your web team to set up UTM tracking so that your posts are credited for traffic to your website.
- Get GA access or a regular report from your web team
- In the best case scenario, you can get access to your Google Analytics instance and build a report or even a dashboard centered on where social traffic goes after leaving the platform. Even if you aren’t able to get permissions, ask the web team to provide you with a spreadsheet of data on traffic from organic social and associated metrics like pageviews, session duration, etc.
- In your reports, show the user journey once they leave the social platform
- This is another great way to demonstrate the value of your presence on social media – by connecting the dots with what happens after someone clicks through on your posts. A lot of social media reporting ends with what happens on the platform. Google allows you to continue your storytelling and helps you showcase how social drives traffic to key pages.
Step Three: Introduce Opportunities for Education
Reports are an opportunity to give your audience the context they need in order to see your hard work and appreciate your results.
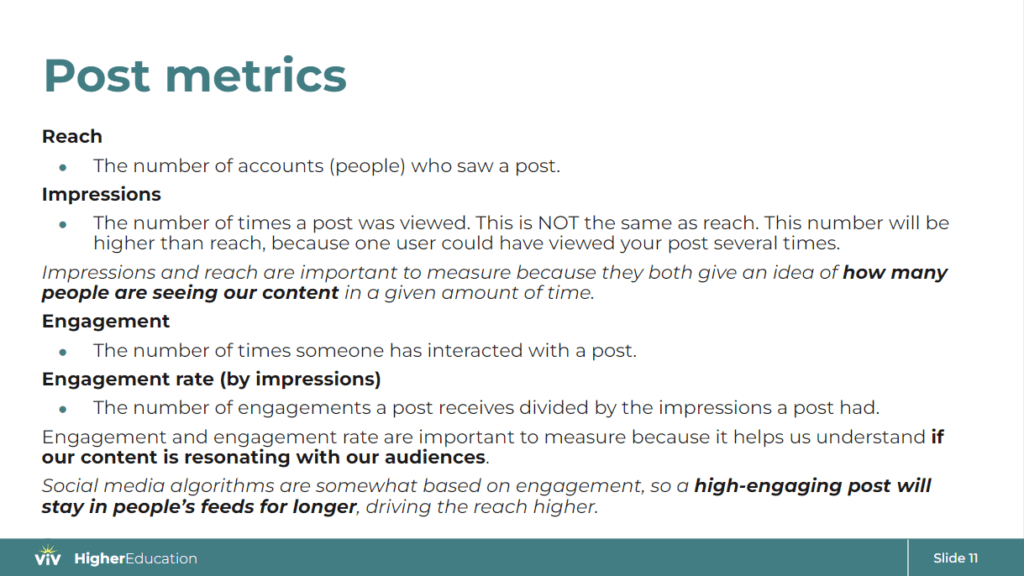
Explain Your Metrics
- Include a glossary or explainer with every report you build
- Touch on what key metrics are in the beginning. This helps hold the attention of your audience, since they now understand the significance of the numbers you’re sharing.
- Define KPIs and how you calculate rates
- This confirms the value and accuracy of your data.
- Add context to trends and differences in metrics across platforms
- Beyond listing impressions and other metrics, it’s important to give context around how and why metrics differ across platforms. For example, engagement rates are going to be higher on Instagram than on Facebook because of the way Instagram is set up to make “liking” really easy. Or it might help to tell them why you’ve posted so much more on Twitter; quantity matters more than quality on that platform.

Outline Relationship Building and Idea Exchange
Social media encourages conversation and collaboration, and this should be reflected in your reporting as well. Highlight relationships you’ve developed and how your content supports (and is supported by):
- Faculty/staff
- Other colleges/schools within your university
- School organizations/student organizations
- Outside organizations/partners
Did a prominent faculty member reshare your content and start a great conversation on the reshared post? Were you able to amplify a student organization’s fundraising efforts that aligned with your institution’s priorities? These aren’t your traditional reporting metrics, but they add life to your report and are tangible examples of how you’ve expanded your reach beyond your followers.
Empower Your Stakeholders as Influencers Who Promote Your Work
- Encourage faculty or stakeholder engagement with thought leadership
- The faculty, staff, or stakeholders that you’re presenting to likely have at least a presence, if not a decent following, on social media. For faculty members, this might be academic Twitter, and for board members, this might lean more towards LinkedIn. Some may be really social savvy, and others may not.
- Develop a guide or “cheat sheet” for how to utilize social platforms
- More often than not, stakeholders are willing to get involved on social media, but they just don’t know where to start. Lucky for them, they have an amazing and talented social media professional willing to show them the ropes! It doesn’t have to be extensive training – consider developing a guide or cheat sheet on engagement for each platform.
Example: LinkedIn Guide
Viv worked with a leading business college’s executive education brand to drive faculty member engagement on LinkedIn. We worked with the marketing team to develop materials and train faculty and staff on how to properly utilize LinkedIn, and the results have been well worth it. Institutional posts that are reshared by faculty members have higher impressions and engagement than posts that are not reshared.
Leverage the Relationship to Be Mutually Beneficial
Faculty members, especially in the business school and executive education world, can be an institution’s best ambassadors. We’ve had faculty members approach us about:
- Sharing faculty newsletters on LinkedIn
- Drafting post templates
- How to tag the institutional account in posts
- Resharing institutional content
This process has also helped us to get faculty members on board for larger asks, like sitting for a few hours with a videographer to get professionally filmed content for social, web, etc. Getting stakeholder buy-in drives reach and engagement, meaning that you will have more impressive numbers to show in future reports.
Connecting Demographics and Strategy
- Demonstrate your distinct audiences via demographics
- By highlighting demographics, you can remind leadership that social isn’t just about reaching students. Instead, you’re also balancing how to speak to their parents, alumni, community members, etc.
- Showcase the variety within and across platforms
- This variety is why you aren’t posting the same content across all platforms all the time. To contextualize, think of how leadership may know that their daughter is on TikTok while they prefer Facebook.
- Explain how these different groups impact your strategy
- Demographic information is an easily gathered, rather digestible way to deepen stakeholders’ understanding of the purpose that each platform serves. It’s also a sustainable way to show follower growth and how you are working to tailor each platform’s content as your audience grows, along with how the makeup of your student body may be growing as a whole.
Example: Social Media Demographics Reporting Helps Drive Strategy
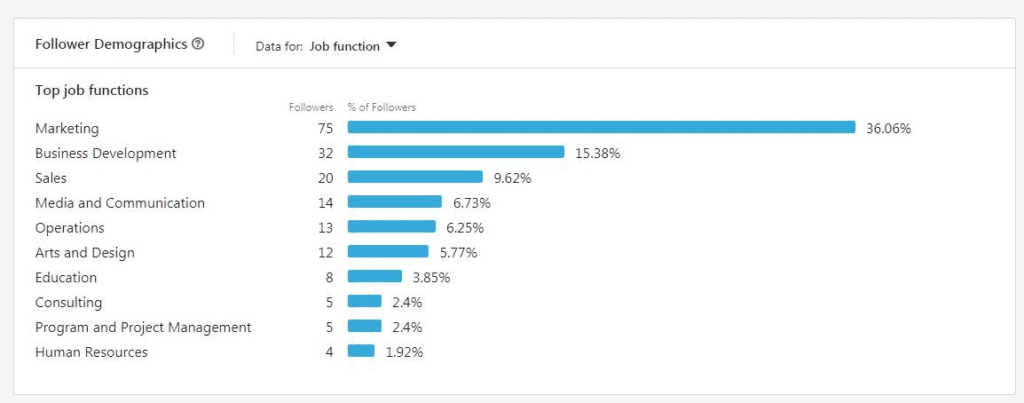
A deep dive into a leading business college’s executive education LinkedIn account resulted in some surprising observations. For example, the brand had a high number of entry-level professionals following them, and IT and pharma were the largest industries (outside of higher education) represented by their followers. This knowledge helped deepen the marketing team’s understanding of who is engaging with the brand’s content and tailor it accordingly. It also helped identify specific areas where they would like to drive follower growth.

Leverage the Data and Examples of Your Competition in Your Reporting
- Consider benchmarking against other universities using in-platform tools
- University rivalries play out in rankings and on the football field – so why not try to best your rivals on social, too? Providing context for how your channels are performing in the wider higher education social media landscape can provide needed context for your stakeholders.
- Show how larger platform trends and shifts are impacting all institutions, not just yours
- This can be helpful in a range of scenarios. Sometimes bots are cleared out or algorithms adjust and you’re suddenly gaining followers at a much lower rate or seeing dramatic drops in engagement. Other times, there are external national or political factors that impact all institutions.
- Example: A Leading University in the UK
- When the Queen passed away earlier this year, we worked with a leading university in the UK to determine the impact of pausing social ads and posts. It’s likely that you’ll be able to see a similar dip in impressions over the mourning period for other UK-based institutions. These external factors will play out in the metrics, and reporting on this proves that not every shift in metrics is your team’s doing.
- This can be helpful in a range of scenarios. Sometimes bots are cleared out or algorithms adjust and you’re suddenly gaining followers at a much lower rate or seeing dramatic drops in engagement. Other times, there are external national or political factors that impact all institutions.
- Provide examples when presenting new ideas, strategies – anything that requires buy-in
- Many of our clients often don’t know what they want a new deliverable to look like – until they see what the competition is doing. They’re able to pick out what they like and dislike, and ultimately, we’re able to produce something really strong because of their feedback.
- The same idea applies here. If you’re trying to justify the cost of hiring a part-time videographer for social, for example, it may be hard to communicate why you can’t just do it yourself and what the ROI is. By showing a few really stellar examples to leadership, you can add clarity to your vision and show them why making a change is necessary.

Explain Strategic Changes You’ve Implemented Since Your Last Report
One of the most challenging parts of social media management is the fact that nothing stays the same for too long. This is in direct contrast to higher education as a whole. Because institutions can be so resistant to change, it is important that we illustrate how and why we make changes, and what the results are.
Changes to Report On
- A/B test results
- New content types
- New processes
- Show how these changes will strengthen your future approach
Don’t Be Afraid to Talk About Failure
It’s inevitable that something you tested underperformed, or downright flopped. It can be tempting to gloss over this, but showing your attempts to improve illustrates your commitment to the sustained success of your platforms. Though one tactic may have not worked, this new knowledge shapes your decision-making moving forward – and brings you closer to a future victory.
Summary of How to Level-Up Your Social Media Reporting
- Tailor reports to your stakeholders
- Build storytelling into your reporting
- Add Google Analytics data and competitive metrics to your report
- Define terms and concepts for a common understanding
- Identify key influencers and encourage faculty engagement
- Provide demographics by platform
- Complete competitive analyses
- Highlight A/B tests, trials, and strategy changes
Learn more about our work in Media & Analytics.
